In 2020, Statistics Canada (StatCan) and Canada Mortgage and Housing Corporation (CMHC) collaborated on the implementation of a set of proximity measures to services and amenities. CMHC funded this collaboration to generate data and analytical work in support of the National Housing Strategy. The result of this collaboration is the first nationwide Proximity Measures Database (PMD).
The database contains 10 measures of proximity and a composite indicator that combines some of the proximity measures. All measures are at the dissemination block level (a block in urban areas or an area bounded by roads in rural areas), this provides the highest level of geographic resolution currently possible.
This tool can help local governments review their built environment and find how different neighbourhoods have varying levels of amenities.
The Measures of Proximity included in the PMD are:
Amenity-dense neighbourhood: An aggregate measure to indicate neighbourhoods that have access to basic needs for a family with minors. A dissemination block with access to a grocery store, pharmacy, health care facility, child care facility, primary school, library, public transit stop, and source of employment is referred to as an amenity-dense neighbourhood.
Smart Growth Online is a website which supports economic growth, strong communities and environmental health. The website is a project of the Maryland Department of Planning and is funded by the U.S. EPA Office of Sustainable Communities and is the web presence of the Smart Growth Network. One of the unique elements of the website is that they host webinars frequently while discussing various aspects of land use and transportation planning, such as walkability, cycling, mixed-use development, the value of street trees, social equity and more. Smart Growth Online also provides a mailing list to keep updated on upcoming webinars and resources. Although the subject matter of the site is configured for a U.S. audience, many elements are transferrable to a Canadian context. In addition, there are many overlapping concepts when comparing smart growth to complete, compact communities.
This report compares the environmental life cycle assessment (LCA) of both Electric Vehicles and Gas Vehicles in the road transportation sector. Impact assessments are carried out at vehicle’s manufacturing (mining and assembly), use (driving) and end of life (recycling and disposal) phases. In this environmental life cycle assessment of electric vehicles in Canada, the GHG emissions and primary energy consumption are considered as the most significant impact category.
In order to further the development of more transit-oriented communities in Metro Vancouver, this document provides guidance for community planning and design – based on best practices – in the areas surrounding transit stations, exchanges, and stops.
The concepts of transit oriented communities are applicable in broad range of contexts. This guide may be of interest to communities outside of Metro Vancouver.
This report illustrates the continued progress by local governments to reduce carbon emissions through highlighting examples of the achievements and experiences of small, medium, and large communities in 2018. It includes:
Update on local government progress towards corporate carbon neutrality
Highlights of climate mitigation and adaptation actions taken by small, medium, and large communities across BC
Hyperlinked list of funding sources and programs used by local governments in support of climate action
A Guide to Green Choices provides practical advice and ideas for local governments making land use decisions. The guide is meant to assist communities of all types (large, small, rural, resort-based, urban, etc.) and maximize both creativity and adaptability to varied scales, specific contexts, and changing on-the-ground conditions. It provides ideas and guidance across seven key issues that or common themes in planning growth and land use: green settlement patterns, protecting natural features, integrating settlements with nature, community economy, transportation choices, social inclusion, and food supply.
The Partners for Climate Protection (PCP) program is a network of more than 160 Canadian municipal governments that have committed to reducing greenhouse gases and acting on climate change.
PCP is a partnership between the Federation of Canadian Municipalities (FCM) and ICLEI – Local Governments for Sustainability. It is the Canadian component of the international Cities for Climate Protection (CCP) program. PCP receives financial support from FCM’s Green Municipal Fund (GMF), which is managed by the FCM Centre for Sustainable Community Development.
PCP offers:
A plan: PCP’s five-milestone framework is a proven municipal strategy to cut GHGs.
Resources: PCP members have access to useful resources and information, including case studies, templates, technical assistance and newsletters.
Networking: PCP offers valuable opportunities to share experiences with more than 150 participating municipalities, and with an international network of municipal governments.
The number of bike trips in Vancouver increased over 40% soon after the implementation of the City’s Separated Bicycle Lanes Program, resulting in fewer commutes made by vehicles and lowered traffic related GHG emissions.
Project Summary
The City of Vancouver launched aSeparated Bicycle Lanes(SBL) Program in 2009 with construction of a major cycle track on a high-traffic city bridge — the Burrard Bridge cycle track.
The City opened three more separated bike tracks by the end of 2010. The three tracks (the Dunsmuir Viaduct, Dunsmuir Street and Hornby Street) together connecting the Vancouver’s west side through the downtown to east Vancouver. Since then, citywide cycling ridership has grown over 40% while collision rates between cyclists and vehicles have fallen.
Safety was indicated as one of the biggest barriers to cycling in Metro Vancouver, based on a UBC study. This barrier influenced the design decisions when designing the cycle tracks. The City implemented both one-way and two-way separated bike-lanes. Availability of space was a factor in whether one-way or two-way lanes were built with a strong preference for one-way facilities on streets with two-way motor vehicle traffic.
Before constructing the Dunsmuir Street track, the City analyzed and tested three different types of barriers between the track and traffic. The three barriers were a row of planters, a concrete median with bike parking, and a row of parked vehicles. They found the cost of bike lane construction was less for sections that were protected by parked cars. These sections also worked best with one-way bicycle traffic. Bike lanes separated from traffic with a physical barrier create safer cycling conditions and increase comfort level for people of all ages and abilities.
Other improvements to cycling infrastructure include:
highlighting potential conflict zones with paint and pavement markings;
designing safer intersections and crossings with improved visibility;
addressing potential conflicts through turn restrictions and signal priority;
using painted bike boxes to facilitate turn movements;
addressing ‘dooring’ concerns with a buffer space between parking cars and the bike lane; and
designing for safe, accessible transit stops with level treatments and space for lining up in the buffer space between the bike and motor vehicle lanes.
Encouraged by this initial success, the City expanded its efforts and defined new cycling goals in the Transportation 2040 Plan. The Plan also directly supports the Greenest City 2020 Action Plan. goal to have the majority of trips in Vancouver be by transit or active transportation modes.
Actions set in the new Transportation 2040 Plan (for example, to achieve the target of having two thirds of all trips be by alternative transportation) will greatly expand active transportation options in Vancouver. Expansion will provide healthier alternatives to commuting by vehicle and help reduce amount of air pollution.
The City is moving forward and will add a host of new or improved cycling facilities including upgrades to the busy Adanac Bikeway, a Canada Line bridge connection in South Vancouver, and improvements to the north end of the Cambie Bridge.
Energy Savings/GHG reductions
Cycling is estimated to be the fastest growing mode of transportation in Vancouver. Within three years of installing the first separated cycle lane in the city, the number of trips made on bicycles increased over 40%. Cycling ridership continues to increase city-wide and on individual corridors.
Vancouver’s overall cycling mode shares compare favourably across North America, typically ranking around the top three. Increase in the number of commutes by cycling contributes to lower GHG emissions due to fewer trips made by vehicles and shortened time it takes for vehicle travel.
Even more ambitious target was set in the Transportation 2040 Plan to have cycling, walking and transit account for two thirds of trips in Vancouver by 2040.
An even more ambitious target was set in the Transportation 2040 Plan to have cycling, walking and transit account for two thirds of trips in Vancouver by 2040.
Business case
Since the program’s implementation the number of bike trips was on the rise while number of collisions started declining. Within less than a year of opening the Dunsmuir lane ICBC recorded a drop of 18% of all collisions. The Bicyclists’ Injuries & the Cycling Environment, a study by the UBC Cycling in Cities research program suggests that cycle tracks result in a nearly 10-fold reduction in cycling collisions, compared to major streets without bicycle facilities. This reduces stress on emergency services and health care.
Co-Benefits
Lifestyle
By encouraging active transportation, the City supports healthier and more affordable lifestyles, improved mental health, decreased injury rate and obesity—which all contribute towards reduced long-term burden on health care system. Bicycle and pedestrian oriented development helps create cohesive, vibrant communities with improved social interaction. Studies related to these co-benefits can be found on the University of British Columbia’s Faculty of Medicine website.
Pedestrians have more room to walk because of the bike lanes. The bike lanes act as a buffer between the sidewalk and car traffic helping to reduce incidences of people cycling on the sidewalk. Since cycle track installation, number of cyclists using sidewalks on Hornby Street dropped by 80%. The bike lanes also create space for some street furniture (such as bike racks) to be relocated into the buffer space between the bike and motor vehicle lanes leaving more space on the sidewalk.
Economic
There are financial benefits for local business—surveys show that people who cycle often have more disposable income than drivers, are more likely to shop locally, and tend to spend more money over the course of more frequent shopping trips. In addition, the cost of building cycling infrastructure can be less than building infrastructure for automobiles.
Lessons learned
A robust monitoring program is important
Many cycling infrastructure projects require road space reallocation of some kind, often from general traffic or parking lanes and may use traffic calming or diversion tactics to reduce motor vehicle traffic and speeds. With these changes, concerns may be raised about loss of parking, increased travel times for motor vehicle traffic, or more congestion.
Data collection provides real evidence
Data collection and monitoring can provide real evidence to dispel some of these concerns, communicate tangible benefits, and even help improve performance after projects are built. The City regularly measures things like parking availability, collision rates, traffic volumes for all modes, and travel times. Thus far, the projects that have been built have increased cycling ridership and safety without significant congestion or travel time impacts.
Local government contact
Dale Bracewell
Manager, Active Transportation, City of Vancouver
T: 604-871-6440
E: dale.bracewell[at]vancouver.ca
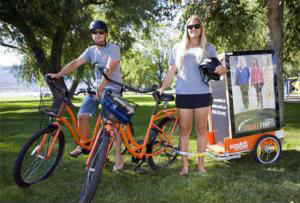
Kelowna SmartTRIPS Program (image courtesy of City of Kelowna)
Kelowna’s smartTRIPS Program encourages citizens to use non-motorized transportation and transit.
The goal of Kelowna’s smartTRIPS program is to work more directly with residents of a specific neighbourhood to help them to increase biking, walking, transit use, carpooling, and other active transportation options. The program aims to reduce single occupancy driving trips.
Project Summary
Kelowna’s smartTRIPS program is a partnership between the City of Kelowna, Regional District of Central Okanagan, District of West Kelowna, District of Peachland, District of Lake Country and Westbank First Nation developed to address region-wide climate action in the transportation sector. The program encourages residents to reduce the use of personal vehicles and increase the use of active transportation through walking, cycling, and taking transit.
In Spring 2012, Kelowna launched their first neighbourhood trip planning project in Pandosy, the pilot neighbourhood for smartTRIPS neighbourhood program. The program ran for 10 weeks, targeting 1500 households and a small town centre/commercial area. smartTRIPS was based on the community-based social marketing (CBSM) strategy, an innovative approach designed to communicate benefits of a desired activity in addition to identifying and removing barriers which impede a desired long term behavioral change.
The key elements of the Pandosy smartTRIPS program design were: obtaining a commitment from residents, focusing on establishing personal contact to engage citizens rather than distribution of general information, and encouraging residents to actively track changes in their transportation behavior.
The Pandosy pilot involved the following:
Inviting residents in each household to participate in the program and to request specific resources such as transit guides, cycling and walking maps, bike maintenance and safety guides etc.
Integrating the program with other existing programs such as Bike to Work and Bike to School Week.
Encouraging residents to use the proprietary online trip tracking tool to follow number of trips made, km travelled, calories burned and greenhouse gas emissions reduced.
Adding Kelowna’s city-wide bicycle network to Google Maps to allow residents to plan cycling trips.
Establishing new partnerships and strengthening existing relationships between local governments and neighbourhood businesses.
Conducting traffic counts (all modes) at key intersection as well as transit ridership counts at all neighborhood bus stops prior to program implementation in order to further evaluate its impact on mode shift.
Distributing general transportation survey to all residents in Pandosy prior to the program and one year later, to help gauge program impact on participants and non-participants alike. In addition, participants were sent a survey to evaluate the program.
Pandosy smartTRIPS program evaluation survey results indicate that 50% of participants were using active transportation more than they did prior to the program, and more than 90% said that they would continue to use active transportation.
Energy Savings/GHG reductions
In the 2011 baseline survey, 55% of respondents reported using motorized vehicles for commuting an average of 12.1km to work/school. One year later, in the 2012 post pilot survey, respondents using a motorized vehicle reduced to 49% and the average commute distance dropped to 7.1km. It is estimated that this represents an overall 47% reduction in VKT to work/school for the neighbourhood.*
In the 2011 baseline survey, 64% of respondents said they use their car daily, while in 2012 post pilot survey, that number dropped to 57%. This represents an overall reduction of 7% in daily vehicle use.
For households participating in the program, the primary mode of transportation ‘own vehicle’ reduced from 67% to 64%.
* Please note that this answer was interpolated since combining answers from a few survey questions was the only way to make this calculation!
More than fifty per cent of participants are using active transportation more than they did prior to the program, and more than ninety percent said that they would continue to use active transportation.
Business case
The smartTRIPS program development cost, including the delivery of Pandosy neighbourhood pilot was $58,900, $28.08 per household in the target area. Payback is difficult to calculate but includes increases in transit revenue, and reduced impact on transportation infrastructure (road and parking facility construction costs).
Co-Benefits
In addition to curtailing the greenhouse gas emissions from vehicle travel, reducing noise and air pollution, contributing to improved health and quality of life as well as potential reduced healthcare costs, there are other less direct, potential co-benefits; for example, fostering a stronger sense of community, supporting local area shopping, encouraging community ambassadors for active living, and increasing the visibility of active transportation modes. See report by Victoria Policy Transport Institute the for more information on co-benefits.
Average vehicle operating cost savings: $0.225* (cents per reduced motor vehicle-mile)
Average parking cost savings: $0.360 (cents per reduced motor vehicle-mile)
*Larger savings result if some households can reduce vehicle ownership costs.
Lessons learned
Have a number of specific targets
The program goal to reduce VKT and increase the use of active transportation was very broad. Although some measurable targets were set (eg. 10 -20% reduction in VKT), a greater number of specific targets would have been more useful for the program.
Increase Community visibility
Organize staff attendance at many existing community events, block parties, etc. with an information booth to attract more community participation and awareness.
Local government contact
Mike Kittmer
Active Transportation Coordinator
Regional Services Dept.
T: (250) 469-8531
E: mkittmer@kelowna.ca
Saanich integrates electric vehicles (EVs) into the municipal fleet (image courtesy of District of Saanich)
Saanich’s Fleet Department achieves 14% reduction in GHG emissions through participating in the E3 Fleet Program and initiating a variety of fleet management strategies.
To achieve ambitious GHG emissions reduction goals set in the Official Community Plan, the District focused on increasing fuel efficiency, reducing harmful emissions, and incorporating new technologies and fuel sources into operations.
Project Summary
In 2010, Saanich’s Official Community Plan set a corporate GHG emissions reduction goal of 50% by 2020 based on 2007 levels, including a 50% reduction in fuel related emissions. A key component of Saanich’s Climate Action Plan has been the integration of electric vehicles (EVs) into the municipal fleet. The purchase of fuel efficient vehicles has had an immediate and measurable impact on emissions reductions.
Efforts began in 2007 when the Municipality’s fleet manager signed up Saanich to participate in the E3 Fleet Program, Canada’s first green rating system for fleets, managed by the Fraser Basin Council. Saanich completed an Action Plan based on the E3 Fleet review which provided a clear set of performance indicators used to achieve fuel consumption reductions. Saanich made commitments to increase fuel efficiency, reduce harmful emissions, and incorporate new technologies and fuel sources into operations. Saanich is the first local government in North America to commit to the Pacific Coast Collaborative (PCC) pledge to purchase at least 10% zero-emission vehicles for all new purchases.
Much of the fleet changes focused on vehicle right-sizing, which involves utilizing the most fuel efficient vehicles to complete tasks. Steps were also taken to target fleet conversions from gas to high efficiency diesel. Fleet management incorporated full life-cycle costs of new vehicle purchases and the Carbon Fund was used to help pay for new hybrid and electric vehicles. Saanich now uses four EV Nissan Leafs in its municipal operations and is scheduled to have four more EVs by the start of 2016. The police department also has a Mitsubishi EV for court liaison purposes, making it the first police department in Canada to incorporate an EV into its fleet. Behavioural changes were initiated through staff engagement on fuel efficient driving techniques and efficient route planning which helped reduce unnecessary fuel consumption.
Saanich was recognized for its success in 2014 by garnering an honourable mention at the annual Community Energy Association (CEA) awards. In 2013, Saanich was awarded top honours by the Federation of Canadian Municipalities (FCM) Partners for Climate Protection (PCP) program for achieving the 5th and final milestone of PCP, a level achieved by only eight communities in Canada at that time. Saanich has committed to gradually expand its EV fleet pool and to seek opportunities for EV use in other municipal departments. Effort has continued into 2014 including continued purchase of additional EVs, utilization of new efficient waste fleet vehicles, municipal pooled fleet vehicles and a fuel data management and tracking system. It is hoped these initiatives will propel Saanich towards reducing their corporate emissions by 50% by 2020.
Energy Savings/GHG reductions
Saanich’s fleet management strategies achieved a 14% decrease in fleet GHG emissions since 2007. This amounts to a reduction of emissions by 400 tonnes annually and a cumulative reduction of 3,627 tonnes. Saanich consumes 90,000 fewer litres of fuel per year and has saved a cumulative 1,028,000 litres of fuel. The EVs in use have an anticipated life cycle savings of 98% less GHG emissions when compared to a gas vehicle of the same class.
Saanich encourages local governments to incorporate life cycle and carbon cost accounting into decision making.
Business case
Reduced fuel consumption is now saving the municipality $108,000 annually and a total of $1,230,000 since the project began. The use of an EV reduces energy costs for that vehicle by 90%. Vehicle replacement was funded using existing fleet vehicle replacement capital, the sale of old vehicles and through Saanich’s Carbon Fund. The municipal Carbon Fund, established in 2007, directs offsetting funds, about $120,000 annually, towards corporate emissions reduction projects. Energy and fuel saving projects are evaluated for their carbon reduction potential, which helps determine the amount of funding that can be accessed.
Co-Benefits
Saanich’s fuel efficiency initiatives demonstrate leadership in contributing to a community-wide shift towards low and zero emission vehicle use. Saanich has demonstrated the benefits of EV use especially with respect to life-cycle cost accounting. Fleet and behavioural changes also contribute to cleaner air in the community.
Lessons learned
Saanich encourages local governments to incorporate life cycle and carbon cost accounting of new vehicles into decision making. The program has been successful because of the broad assessment of costs and benefits associated with the full range of available fleet upgrade opportunities. The early efforts to incorporate this philosophy in fleet purchases has supported the development of new Sustainable Purchasing Guidelines at Saanich and incorporating sustainability language into the recently updated Saanich Purchasing Policy. This process is essential for building a strong business case for investment in zero-emission vehicles. A high level of support from council and management was also required for these initiatives to be successful and mainstreamed into corporate culture.